

Hello Admins! Once in a while, something weird happens and we just can’t figure it out. A workflow rule is not firing correctly, data is not being updated, or you get an error and there’s not enough detail. Wouldn’t it be great if Salesforce had a way to give you a lower level review of what the system is doing? Well, it does! These reviews are called debug logs, and they’re a part of every Salesforce Org.
Debug logs need to be turned on. What you generally do is create a debug window that targets a certain user and timeframe. Because debug logs generate a LOT of data, it’s best to have a very short timeframe and immediately begin testing. To enable the logs, follow these steps:
- Click “Setup”
- Search for “Debug”
- Click “Debug Logs”
- Select your User and Start and End Times
- Select your debug log method
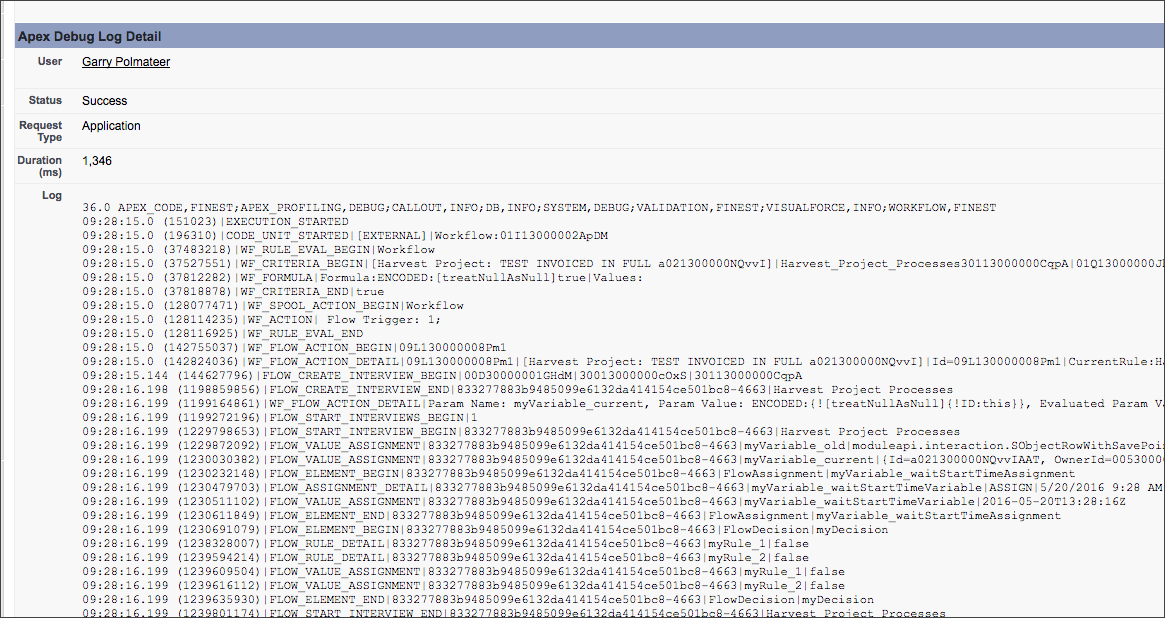
Once the logs are enabled, you can replicate your issue. Repeat the operation as succinctly as possible so that the log is as short as possible. After reproducing the error (check out my troubleshooting blog post for extra guidance), go back to the Debug Log area of setup and click “View” to open your log up.
Now you’ll be inundated by a wealth of information. These logs are basically Salesforce putting together everything that’s part of the story of your attempted data operation–security checks, validation rule checks, code executions, what parameters are passing in and out of things, and more. It’s quite fascinating; you get to peel back the UX and see what Salesforce is really doing behind the scenes.
In terms of making sense of it all, I’m not going to lie–it’s a bit challenging to look at. Often thousands of lines long, it’s hard to put your finger on what’s important.
So here’s what I’d recommend:
Consider the Order – Scan through the whole log and break it into chapters mentally. Try to understand geographically where different chunks of information are located in the log. This might help with knowing which sections you can ignore.
Use Search – Probably the biggest tool in your Ninja belt is the search function. Here are my favorite search terms:
- Error
- Bad
- Fail, Failed, Failure
- Deny, Denied
- Insufficient
- Text that you had in an on-screen error
- Username
- Name of the workflow
- Name of the field
You should be able to highlight areas that are important through some strategic searching.
A Story
I was recently asked to diagnose a custom button that passes event registration detail into an external event registration system. The error presented to the user simply said “Error – Contact your System Administrator.” So I turned on debug logs and replicated the issue, which produced about 500 lines of data. When looking through the log, it became apparent quickly that the SOAP call to the external system was trying to pass in a null email address as the page layout had a custom email field instead of the standard one. Since the other system requires an email address, it was producing the error. In this case, the massive amount of information was easy to sift through and the solution quickly became clear.
Do you use debug logs? If you have any tips to share, leave a comment! Helping resolve these issues is part of our retainer administrator service, so if you need an admin for a few hours per month, we’d love to talk about it!